
Read the battery window and charging conditions before deciding which car will spend less time plugged in.
A quoted charging time can help you compare EVs, provided the figures describe a similar job. An AC charging time for an overnight top-up and a DC fast-charging time for a road trip answer different questions. Start with the kind of charging you expect to use, then compare the cars on your shortlist.
One peak does not describe the session
Make sure the percentages match
A 10-80% claim covers 70 percentage points, while a 0-100% claim includes the whole displayed battery range. They cannot be ranked by minutes alone. Nor can you scale the shorter time to estimate a full charge: power often falls as the battery fills. Keep the exact battery version in the comparison too. The same percentage increase in different-sized batteries need not add the same amount of energy.
Peak power tells you only part of the story
Kilowatts (kW) describe the charging rate at a moment in time. The battery management system requests power from the charger, and that request changes with battery level and temperature. A charging curve shows how the rate varies through the session. To judge the time spent plugged in, look for the time across the battery window you need, rather than choosing the car with the highest peak kW figure.
Will your charger match the claim?
The equipment and conditions behind the quoted time matter. Hyundai India, for example, lists an estimated 18 minutes from 10-80% for the 84 kWh IONIQ 5 and specifies a 350 kW charger for its quickest times. It also qualifies the figure for battery temperature, charger output and other conditions. The charger rating is not power delivered continuously to the battery. Check equivalent details for every car, then check the compatible chargers you expect to use.
Four details to compare
| Detail | Record alongside the time |
|---|---|
| Battery window | Start and finish percentages |
| Vehicle | Exact battery version |
| Equipment | AC or DC; charger rating |
| Conditions | Temperature and stated caveats |
Keep these details with each quoted charging time.
Use the brochure to build a fair shortlist, then ask for a charging estimate for your likely arrival level, target level and charger. That is more useful for planning a stop than the lowest advertised number. Allow time to connect and start the session as well; the charging figure alone is not the entire stop.
Manufacturer claims, not a DriveQuill charging test. Illustration is not model data.
Sources & image credits
Source check: 23 October 2026.
Image credits
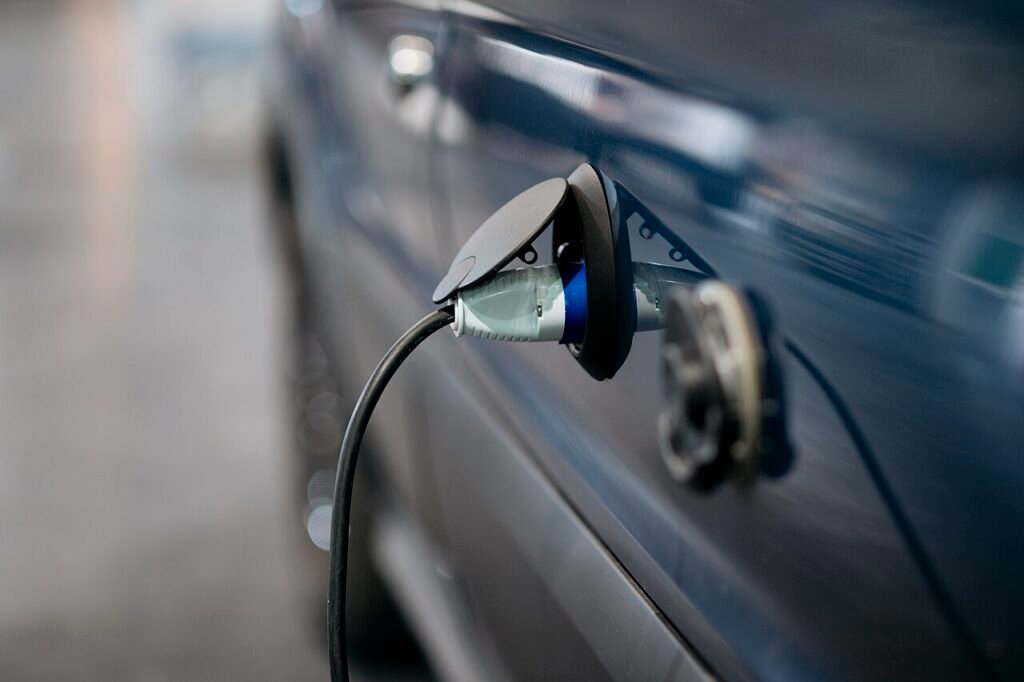
- Photo 1 — A charging cable connected to a car. The power delivered during a session depends on more than the charger’s headline rating.
Photo: Nenad Stojković / Shixart1985 / Wikimedia Commons · CC BY 2.0
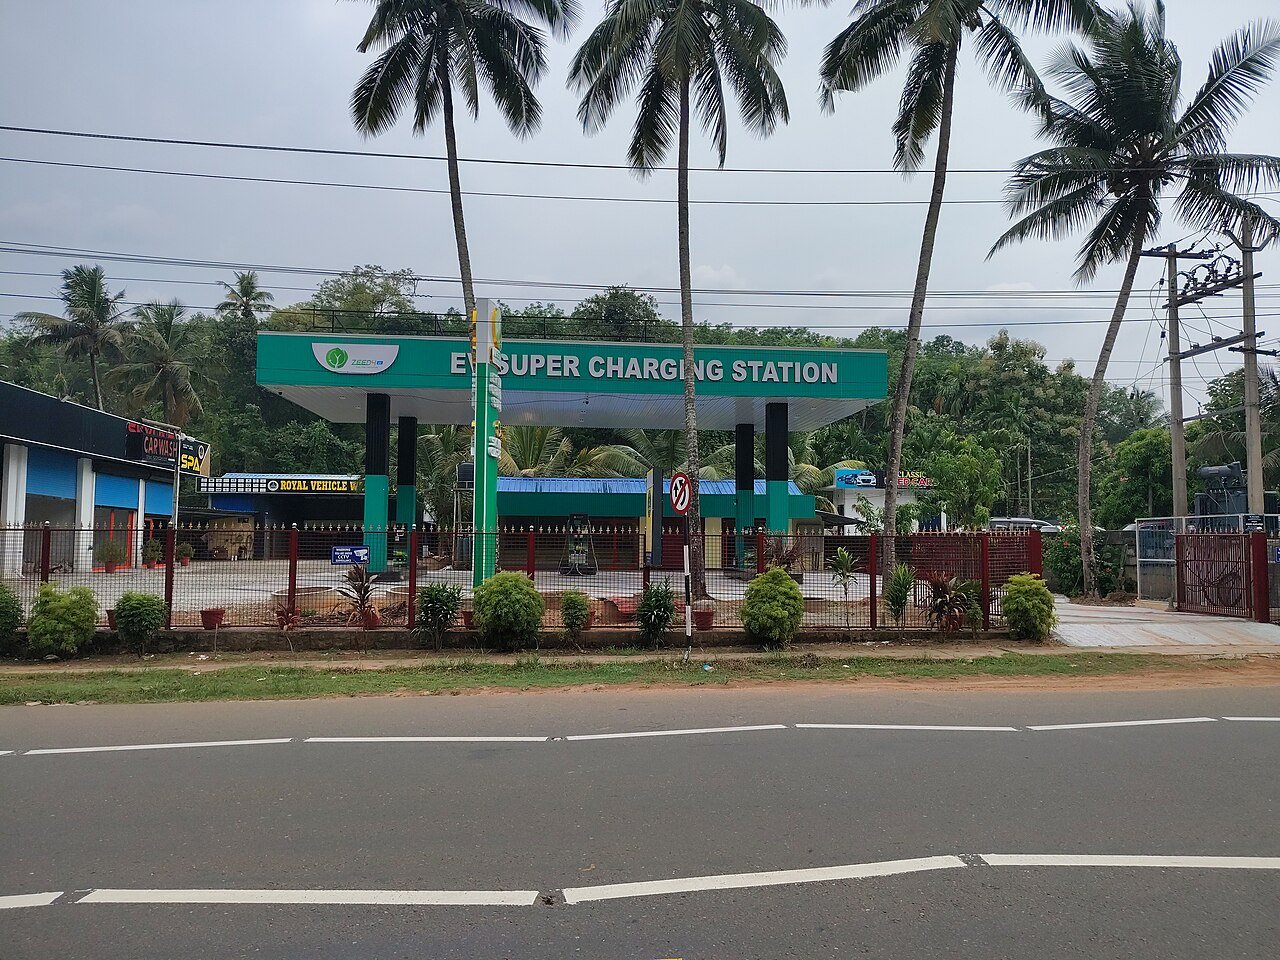
Displayed at resized dimensions only; no crop or visual edits by DriveQuill. - Photo 2 — EV charging station at Valakom, Kollam, photographed in April 2026. Plan a charging stop around the energy needed and the session time, not only a peak power figure.
Photo: Manukrishnan80 / Wikimedia Commons · CC BY-SA 4.0
Displayed at resized dimensions only; no crop or visual edits by DriveQuill.